


Tracking HR metrics is essential for any company looking to get a better portrait of their workers. But which metrics should you choose?
HR metrics give you data that helps you know your employees better. They can also highlight certain issues and ultimately help you make informed decisions to help ensure your business’s success.
Because there are many different types of metrics, they are often grouped together in a dashboard, which can take different forms. Some organizations choose to create their own dashboard in an Excel document while others opt for software specifically designed for this purpose.
Regardless of the method you choose, here are the essential metrics to include in your HR dashboard.
Socio-Demographic Indicators
1. Staff
Your staff, or the number of employees working at your company, is a basic metric.
You should know this information at all times. It can also be used to calculate several other metrics.
2. Average Age of Employees
Your employees’ date of birth, and hence their age, is a basic piece of information to collect for personnel records. The average employee age at your business is calculated as follows:
Sum of employee ages ÷ total number of employees = average age of employees
This information will give you a general idea of your employees’ needs. Workers close to retirement have different concerns than younger people who are starting a family, for instance.
3. Gender Parity
The gender parity at your company is an important HR metric to track, giving you a better overview of your staff with respect to management positions or certain types of jobs.
If you see a disparity starting to emerge, you can reassess your recruitment methods and adjust as necessary.
4. Diversity
Diversity metrics can relate to many things, such as gender, age, marital status, ethnicity, sexual orientation, and religious beliefs. It can be worthwhile to track these metrics in order to highlight diversity issues to address at your organization.
💡 Be careful—asking your employees for certain diversity-related information can be considered discrimination. Aside from the information necessary for their work, your employees are not required to disclose certain information to you.
However, you may want to explain to your employees that you would like to collect this information in order to improve diversity at your company. The important thing is that no one feels pressured to answer your questions.
5. Employees’ Level of Education
It can be helpful and useful to know the education level of your employees. You can then classify this information according to the positions occupied by different individuals. This will give you a better picture of the level of education required for certain types of jobs.
HR Performance Metrics
6. Payroll
Tracking your company’s payroll will give you better control of your budget and help you adjust your objectives as needed. The formula to calculate your payroll is:
Total gross pay + premiums and bonuses = payroll
This metric provides insight into the weight of staff in your business’s turnover.
7. Labor Cost
Labor cost is the actual cost (including employer contributions) paid by a company for the work of its employees. It provides a general overview, but you can also get a more specific picture by looking at how labor costs vary according to the time of the day, week or month. You can also determine an average if helpful.
For example, restaurants will be able to establish when they need more employees on the floor, and adjust their employee schedules accordingly.
Some scheduling software even lets you calculate your labor costs directly to make your job easier.
8. Revenue per Employee
Revenue per employee is the average amount of money each employee helps a company generate. It is calculated as follows:
Business’s net revenue ÷ total number of employees = revenue per employee
Generally speaking, the higher the revenue per employee, the better a company is using its human resources. Conversely, a low revenue per employee can indicate suboptimal company performance.
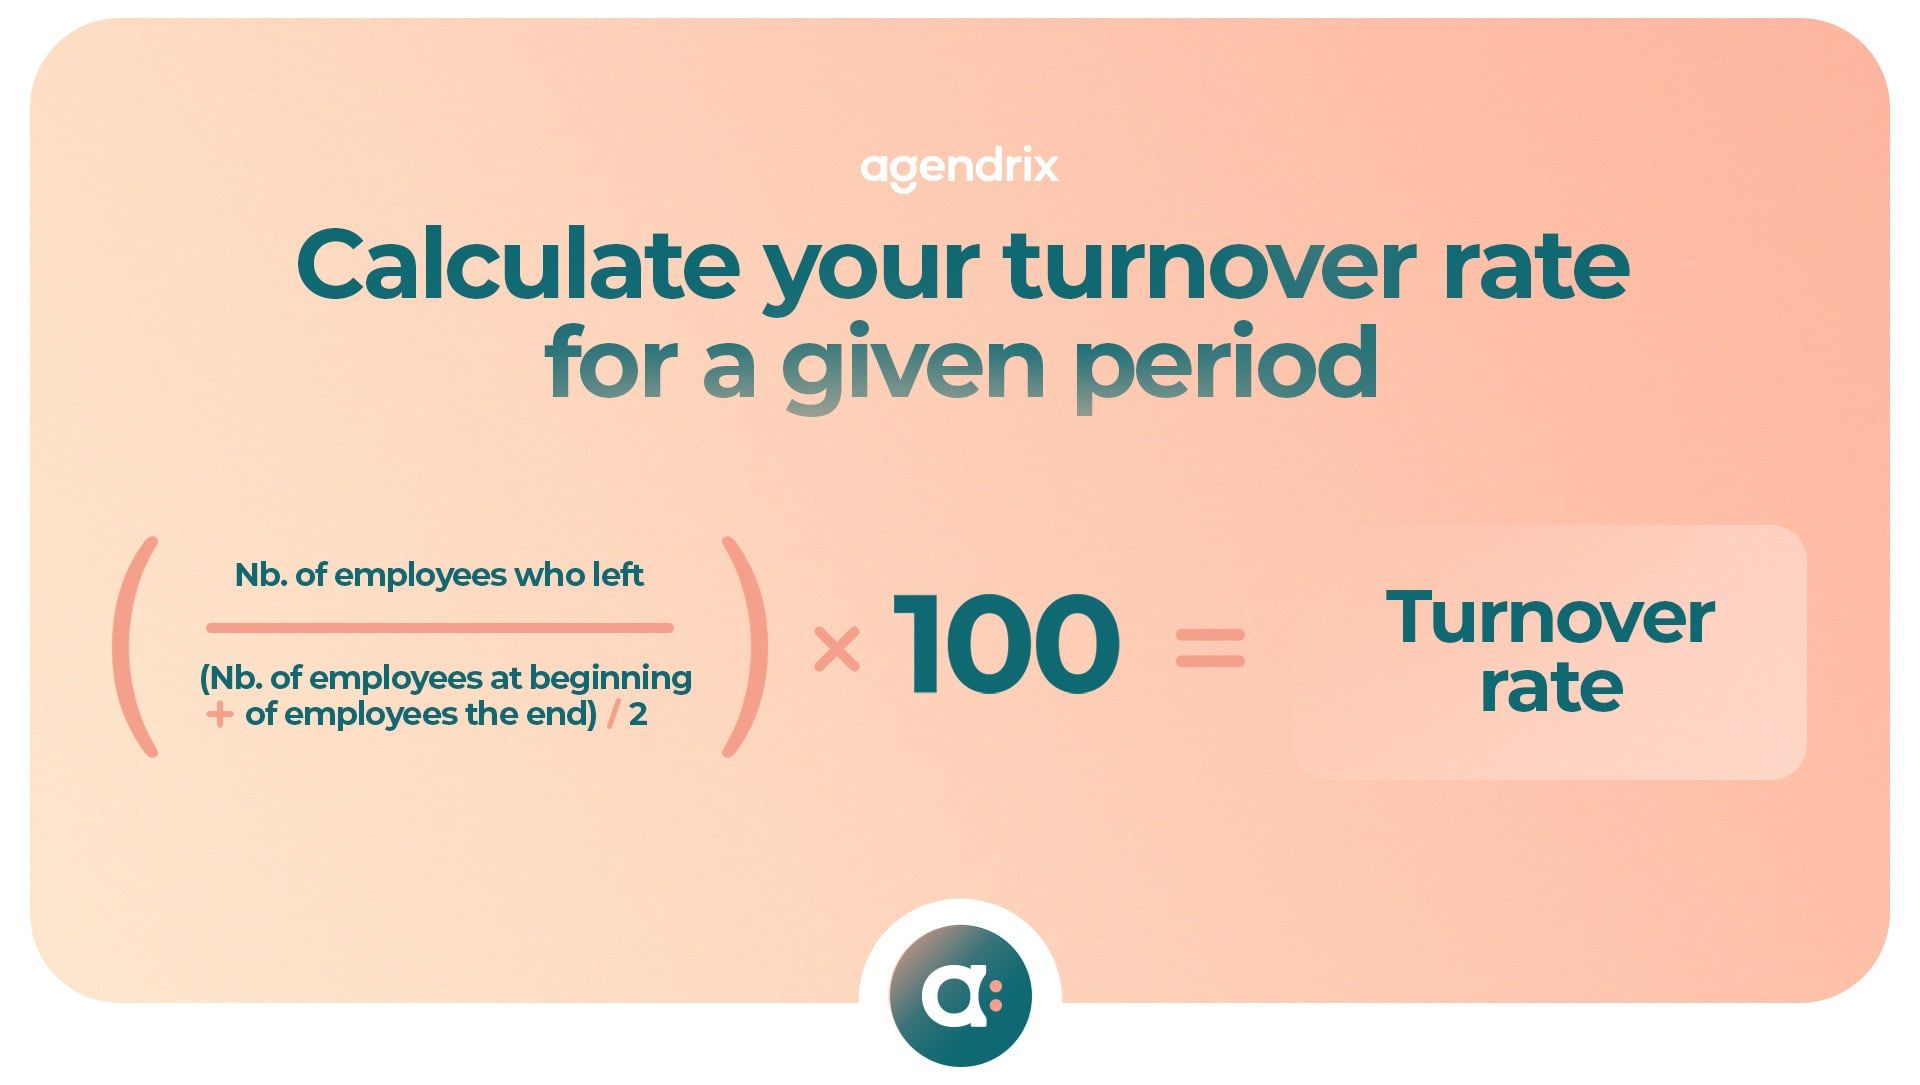
9. Turnover Rate
Your company’s turnover rate is the key HR metric to track in a labour shortage. It’s the difference between the number of employees who left your company and those who stayed on.
It is calculated as follows:
10. Retention Rate
A company’s retention rate is the opposite of its turnover rate. It tells you the number of employees who remained with you during a given period of time. It is calculated using the following formula:
Total number of employees at the end of a given period ÷ (Number of employees at the beginning of the given period + new hires) × 100
11. The Evolution of Performance Evaluations
Tracking your employees’ performance evaluations will let you see if their performance is staying the same, declining or improving over time.
For example, establish a performance scale for your employees and give them a score at each evaluation. This will let you clearly see how they’re progressing.
You can also track the performance of all employees in a given department if the need arises.
12. Number of Overtime Hours
Too much overtime is often detrimental to a company, as it suggests that employees are working too hard and possibly getting burned out. Overtime also increases labor costs.
Always keep track of each employee’s overtime hours for proper record-keeping.
Consider hiring staff, whether full time, part time or even on a temporarily basis, to help address the situation.
13. Employee Seniority
Tracking employee seniority provides a good overview of the expertise accumulated at the company.
It also allows you to highlight your team members’ work anniversaries.
Recruitment-Related Metrics
14. The Cost of Recruitment
Recruitment is an important expense for any company—especially if it has a high turnover rate. It’s crucial to calculate your recruitment costs in order to be able to adjust your practices. You can even compare costs across different types of positions and make sure that your approach is adequate and efficient.
Here’s what you need to consider in your calculation:
- Cost of posting on specialized platforms
- Cost of advertising, if any
- Work time of the person in charge of recruitment and reception
- New employees’ work hours during onboarding
15. Monitoring Your Employer Brand
Monitoring your employer brand allows you to see how it’s doing and determine if any helpful tweaks might be needed. Being proactive will set you apart from other companies.
Here are a few indicators to check in order to properly track your employer brand:
- Number of visits to the “Jobs” section of your website
- Number of resumes received when posting a job
- Employee retention rate
- Number of unsolicited applications
16. Time to Hire
Time to hire is the period of time between posting a position and signing an employment contract. This HR metric shows whether a company is able to respond quickly following a departure and whether its recruitment process is working effectively.
17. Offer Acceptance Rate
The acceptance rate of job offers reflects how successful a recruitment process has been.
Here is the formula for calculating the offer acceptance rate:
Number of rejections ÷ number of acceptances × 100 = % acceptance of offers
If your rate is too low, it means there is a problem with your hiring process.
Training-Related Metrics
18. Cost of Training
The cost of training your employees can include both internal and external training.
It may also be appropriate to distinguish between the two in order to get a better overview of your budget.
You can also divide your budget by your number of employees to get an average.
19. Average Training Time
If you track the cost of training your employees, also consider the average time required for training in order to get a more complete picture. You will have a better idea of how much time your employees spend on this task.
The formula for finding the average time spent on employee training is as follows:
Sum of employee hours of training ÷ total number of employees = average training time of employees
With this metric, you’ll have a better idea of whether you’re meeting your training goals.
20. Training Satisfaction Rate
To find out if the training you’re offering meets your employees’ needs, have them complete an anonymous survey. This way, you’ll be able to determine their satisfaction and adjust your training offer as needed.

Feel free to ask them for suggestions in the way of future training.
Employee Wellness Metrics
21. Employee Satisfaction Index
Regularly measuring employee satisfaction enables you to adopt a proactive stance and address issues before they escalate. Simply send employees a satisfaction questionnaire that they can fill out anonymously.
You’ll then have a better idea of what needs to be improved at your organization, whether it’s working conditions, management methods, salary, or anything else.
22. Absenteeism Rate
The absenteeism rate is an important indicator of employee engagement. An unusually high rate can mean a lack of commitment, or even suggest burnout. Be sure to keep track of this metric and investigate if it gets too high.
23. Employee Net Promoter Score (eNPS)
Your employee net promoter score(eNPS) is the likelihood that one of your employees will recommend your company, as an employer, to someone they know.
The eNPS is calculated as follows:
% of promoters – % of detractors = employee net promoter score
This metric is a reflection of employees’ employment experience and of the loyalty of your team members.
24. Number of Accidents
To better track health and safety at your company, take the time to keep track of the number of accidents that occurred during the year and keep accident reports together in one place. This metric is particularly important for businesses with more physical jobs such as restaurants, retirement homes or grocery stores.
25. Number of Medical Leaves
Employee health should be a priority for all companies. As such, it’s essential to track the number of medical leaves and to classify them according to their underlying reasons in order to get a better picture.
Here are some examples of causes of medical leaves:
- Burnout
- Health problem
- Illness
- Workplace accident
Even More Metrics
Here are some less common metrics that are still worth tracking.
- The balance of the vacation bank;
- Percentage of use of benefits (insurance, telemedicine, sports allowances, etc.).
Managers, to Your Dashboards!
You don’t have to track all the metrics listed above—just the ones that matter to you. Don’t forget to analyze them in order to implement initiatives if necessary. Otherwise your work will have little impact on your organization.
To help you choose which HR metrics to track, start by establishing your needs and your goals. Then you can create a dashboard that connects with your own realities. Happy planning!


Payroll Automation for Canadian Small Businesses: How to Cut Pay-Run Time in Half


Pay Transparency in Canada: What SMB Managers Need to Know (2026)


How to Run Payroll in Canada: A Plain-Language Guide for Small Business Owners