
Imagine being able to literally see your company culture—not just get a sense of it. HR reporting makes it possible by turning workplace dynamics into clear, measurable trends.
We like to think culture is that intangible vibe that makes a team special. But let’s be honest here: without data, you’re essentially flying blind. Real workplace culture is built on what your employees experience every day—and yes, it can absolutely be measured.
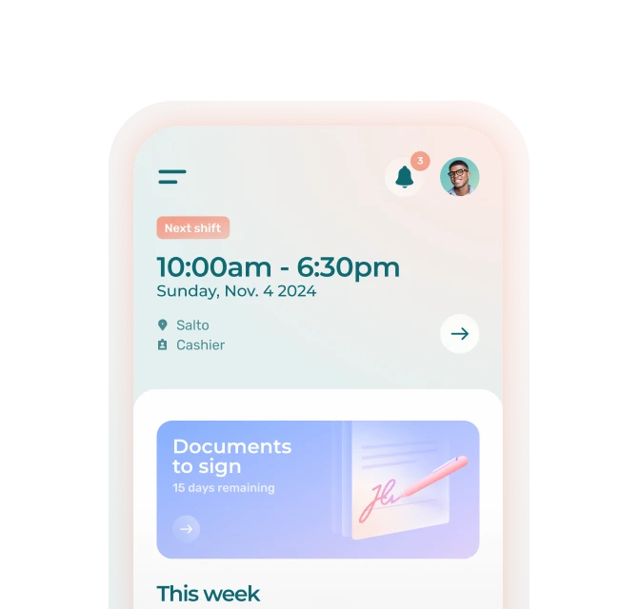
💭 Picture a manager who can track monthly employee satisfaction or turnover in their department.
They don’t just assume things are going well. They can see it, analyze it, and act on it.
What Is HR Reporting?
HR reporting is the process of collecting, analyzing, and sharing key staff-related data within your organization. Think of it as a way to take the pulse of your workforce—using hard facts (KPIs).
Common metrics include employee turnover, absenteeism or engagement levels. With the right insights, managers can make smarter management decisions, faster.
Some key indicators to include in your HR Reporting
Here are some examples of key indicators to include in your HR reporting:
Turnover rate: The percentage of employees who leave the company over a given period.
Absenteeism rate: The proportion of hours or days of absence compared to the total scheduled working hours.
Average replacement time: The time it takes to recruit and train a replacement after someone leaves.
Employee satisfaction: The level of well-being and motivation expressed by employees, often measured through surveys.
Overtime hours: The number of hours worked beyond regular schedules, often indicating a workload imbalance.
Leave requests: The volume and frequency of leave requests, which can reflect work-life balance.
👉 Check out our guide to essential HR metrics.
8 Ways to Improve your Company Culture with HR Reporting
- Create a Clear HR Dashboard
- Foster Transparency
- Support Continuous Improvement
- Spot Early Warning Signs
- Empower Your Teams
- Encourage Open Communication
- Recognize and Reinforce Positive Behavior
- Make Data-Driven Strategic Decisions
1. Create a Clear HR Dashboard
An HR dashboard helps you quickly visualize what’s really going on in your organization. It’s your go-to tool to identify trends and make timely adjustments.
Example: A garden center sees a spike in turnover every spring. By setting up an HR dashboard, data reveals seasonal hires tend to quit after three weeks due to lack of proper training.
🛠 What does the organization do? They revamp their onboarding process and send new hires a check-in survey after the first week.
📈 Result: 25% drop in seasonal turnover and more engaged employees. This is a great example of improved workplace culture, driven by data.
2. Foster Transparency
Sharing relevant HR data with supervisors or shift managers fosters transparency and promotes open communication. This creates a more open dynamic and builds trust at all levels.
Example: A company starts sharing quarterly engagement survey results with all team members across its different departments. Over time, managers start having more honest conversations about issues with their teams.
📈 Result: A more transparent environment and stronger employee-manager relationships.
3. Support Continuous Improvement
Supporting continuous improvement means using HR data to test, adjust and develop your management practices based on what really works with your team.
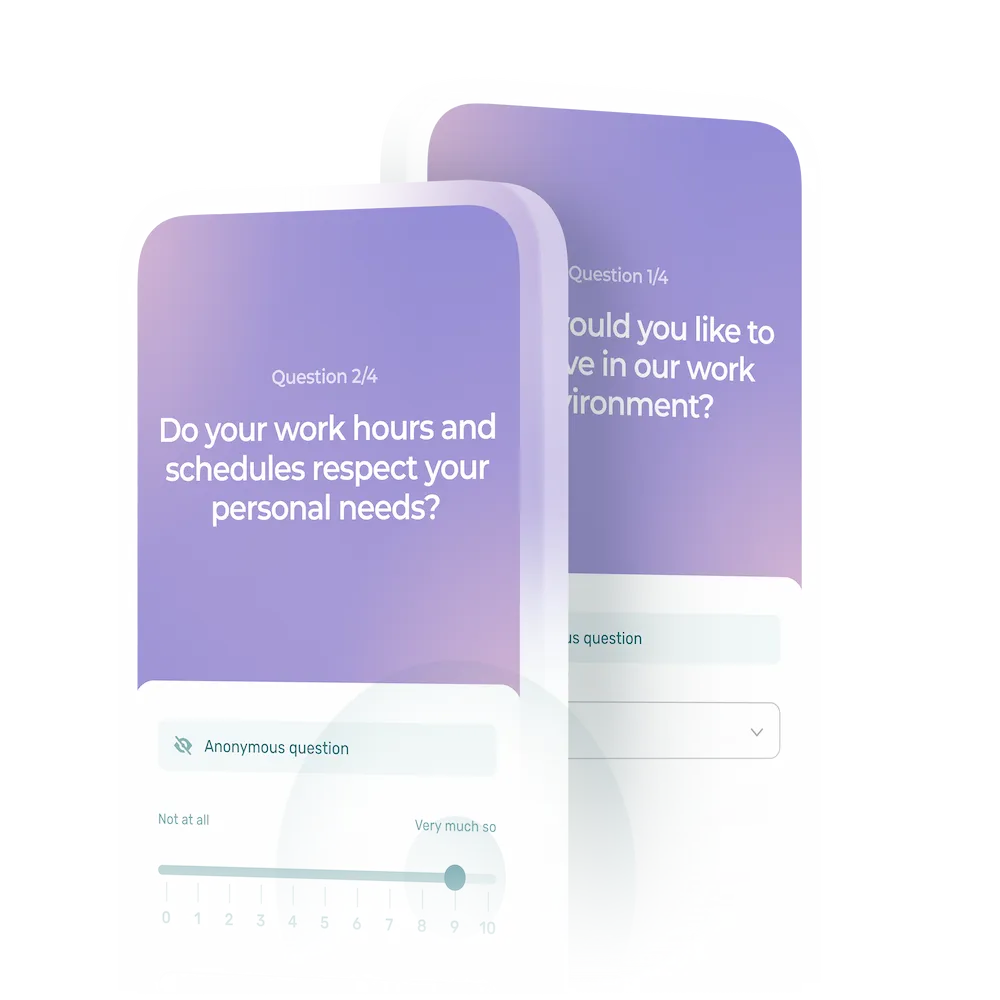
Example: A SMB notices that the participation rate in its training sessions is low. It decides to send out a short anonymous survey to find out why. The results reveal that training schedules are not adapted to employees’ shifts.
🛠 What does the organization do? It adapts the training schedule to better meet team availability.
📈 Result: Participation rises, and staff have a better perception of in-house training sessions.
Tracking indicators over time enables you to detect trends and adjust your practices on an ongoing basis. For example: a quarterly satisfaction survey can become a lever for continuous innovation.
4. Spot Early Warning Signs
Small shifts in your data can signal bigger problems ahead.
Example: A company is seeing a gradual increase in absences in the same department.
🛠 What does the organization do? Managers have confidential one-on-one meetings to identify root causes. It becomes clear that employees are overworked because of new processes that were not understood by the team.
📈 Result: By adjusting the workload and improving internal communications, the team regains its balance and absenteeism gradually decreases.
A gradual increase in absences, a spike in leave requests in a department, or a decline in participation in surveys can reveal work overload or disengagement
5. Empower Your Teams
Give teams access to relevant HR data so they can take ownership of their own improvement. Your teams will become more engaged and autonomous. And they’ll seek solutions before coming to you.
Example: Turnover is high on the evening shift. Data reveals inconsistent schedules are a top complaint.
🛠 What does the organization do? Management asks staff to help redesign schedules before testing the new model for two months.
📈 Result: Lower turnover and greater team buy-in of work schedules.
Data can be used to set team objectives (ex.: reduce turnover by 10%), by empowering everyone in their own way. It’s also an excellent starting point for solution-focused team meetings.
6. Encourage Open Communication
Use HR data to safely surface topics that are otherwise hard to bring up. They serve as a neutral starting point for honest and respectful dialogue.
Example: In a pharmacy, an increase in last-minute time-off requests prompted management to survey employees. Data reveals increased stress due to understaffing.
🛠 What does the organization do? It readjusts schedules and implements a new policy to onboard replacements.
📈 Result: Leave requests drop, team spirit improves and discussions become more open.
With data, it becomes easier to discuss sensitive issues (such as fatigue or conflict) in a factual way, without becoming subjective.
7. Recognize and Reinforce Positive Behavior
Highlighting positive efforts contributes to strong company culture.
HR KPIs enable you to objectively recognize what’s working within a team and individually per employee.
Example: A department sees a dip in absenteeism. Data shows strong team collaboration and more peer support than usual.
🛠 What does the organization do? Leadership acknowledges the initiative and shares it as a best practice across teams.
📈 Result: Boost in morale and a greater contribution to peer recognition.
Have you noticed a drop in absenteeism in your team? Celebrate the good work! Reporting helps to pinpoint successes and reinforce a positive culture.


8. Make Data-Driven Strategic Decisions
Facts, not assumptions, help align leadership decisions with what’s happening in your business. HR data enables managers to make informed, credible decisions for both management and staff.
Example: In a city, the turnover rate is highest for park maintenance staff. Data analysis shows that seasonal employees receive little feedback on their work.
🛠 What does management do? They implement weekly check-ins and a short feedback form at the end of each shift.
📈 Result: Retention improves and employees feel more valued, even among short-term staff.
HR reporting enables you to back up your budget requests, HR projects or organizational adjustments with solid data.
How to Set Up HR Reporting That Works
Main steps in setting up an effective HR reporting system include
1. Track the right metrics
Choose data that reflects the real drivers of your workplace culture (ex.: turnover, engagement, absenteeism).
💡Key metrics will differ from one company to another.
2. Involve your frontline
Managers and team leads know what matters on the ground. Include them when selecting KPIs.
3. Keep it visual
HR dashboards make it easier to spot patterns and take action.
👉Learn how to create a HR Dashboard.
4. Track trends over time
Look beyond one-off results. Monitor indicators over time to identify changes or emerging issues.
5. Share what matters
Communicate the data that helps others act—not just what’s “nice to know.” This will drive engagement and action.
6. Stay flexible
As your business evolves, so should your metrics.
Common Pitfalls to Avoid
⛔ Tracking too much: A cluttered dashboard helps no one. Only stick to relevant metrics.
⛔ Leaving managers out: Make sure they understand and contribute to KPI choices.
⛔ Ignoring context: Data without interpretation and context can be misleading.
⛔ Never adjusting: Your KPIs should evolve as your company does.
Final Thoughts: HR Reporting Doesn’t Replace Instinct
HR reporting doesn’t replace your intuition as manager—it sharpens it by leveraging facts.
It opens the door to deeper conversations, more aligned decisions, and a culture that works in real life, not just on paper.
The secret is simple: listen to your team… and your metrics.
Ready to start building a business where people like to stay, grow and evolve? Start by looking at what your data is already telling you.
What is HR reporting and why is it important?
HR reporting involves collecting, analyzing and presenting key human resources data. It enables companies to better understand their organizational climate, identify issues and base management decisions on concrete facts.
What are the best HR reporting tools?
Spreadsheets or HR platforms that provide ready-to-use dashboards can both work. While Excel or Google Sheets offer flexibility, they can become difficult to manage as your team grows.
Specialized HR software—like Agendrix, BambooHR, or ADP—offer integrated reporting features that save time and reduce errors. These tools centralize data, automate calculations, and provide visual insights in just a few clicks.
How often should I update HR reports?
Monthly or quarterly reporting is usually ideal for spotting trends. However, the frequency depends on your goals. For example, staffing reports might be reviewed weekly, while engagement surveys may be analyzed quarterly.
The key is consistency—up-to-date reports help you act proactively, not reactively.
Which HR metrics should I prioritize?
Start with staff turnover, absenteeism, and engagement—then expand based on your needs. For small to mid-sized businesses, other valuable metrics include: time to hire, training completion rates, and scheduling compliance.
Choosing the right KPIs depends on your industry and organizational goals.
Is HR reporting useful for small businesses?
Absolutely. Even basic data can lead to powerful improvements when tracked consistently. A small business can benefit greatly by spotting scheduling issues, understanding employee satisfaction, or identifying patterns in absenteeism.
Better decisions come from better visibility—even on a small scale.
What’s the difference between an HR report and an HR dashboard?
HR reporting is a global process for analyzing HR data.
An HR dashboard uses data from HR reporting to build a visually compelling summary that can be used to monitor data in real-time and take swift action.
Can HR reporting prevent employee turnover?
Yes—by helping you identify the root causes that drive away employees before they become major issues. High turnover often signals underlying problems such as workload imbalances, scheduling conflicts, or disengagement.
Regular reporting helps you detect these red flags early and take meaningful action to retain your team.
How does HR reporting influence company culture?
HR reporting shines a light on what’s really happening and encourages data-informed decisions. For example, tracking shift swaps, overtime, or time-off requests can promote transparency and fairness.